Most important, the partnership
assumes revenue visibility over the
long-term.
The organised player, adds capacity
at a lower investment of a greenfield/
brownfield expansion, gets additional
volume, increased revenue from
day one and moves closer to
the consuming markets which
mitigates increasing logistics costs –
strengthening business growth and
profitability.
Demand:
The Indian housing stock
accelerated in the last decade, with
urban stock growing at a healthy 4.1%
and catalysing tile industry growth.
The factors that catalysed tile industry
growth comprised the following:
Easier credit accessibility; tax
benefits in housing loans
Decline in the cost of tiles as a
proportion of housing costs
Increasing wealth and consumer
aspirations dovetailed with a widening
product range (superior to natural
stone)
The industry enjoyed an increasing
ROE despite inflation, marked by the
following:
Better assets-turnover ratio for
incrementally lower capex and the
industry moving towards bigger and
value-added tiles
Higher capacity utilisation to meet
growing demand
Growing preference for the JV
model (branded players partnering
with the smaller Morbi players)
Outlook:
The spread of roads,
telephones and electricity is helping
urban centres expand. As wage
growth remains strong, ‘new urban’
consumption goods (like tiles) are
expected to report robust demand.
Despite a robust growth by the
organised tiles sector over the past
years, per capita consumption of
ceramic tiles in India is only a seventh
of Brazil’s, a sixth of China’s and a third
of Indonesia’s.
About 80%-85% of tile demand is
driven by new housing or first-time
users, while the balance is derived
from replacement. Interestingly, new
housing demand is expected to emerge
from non-metro locations (smaller
urban centres, Tier-II and III towns)
while replacement demand is expected
to be largely a metro phenomenon.
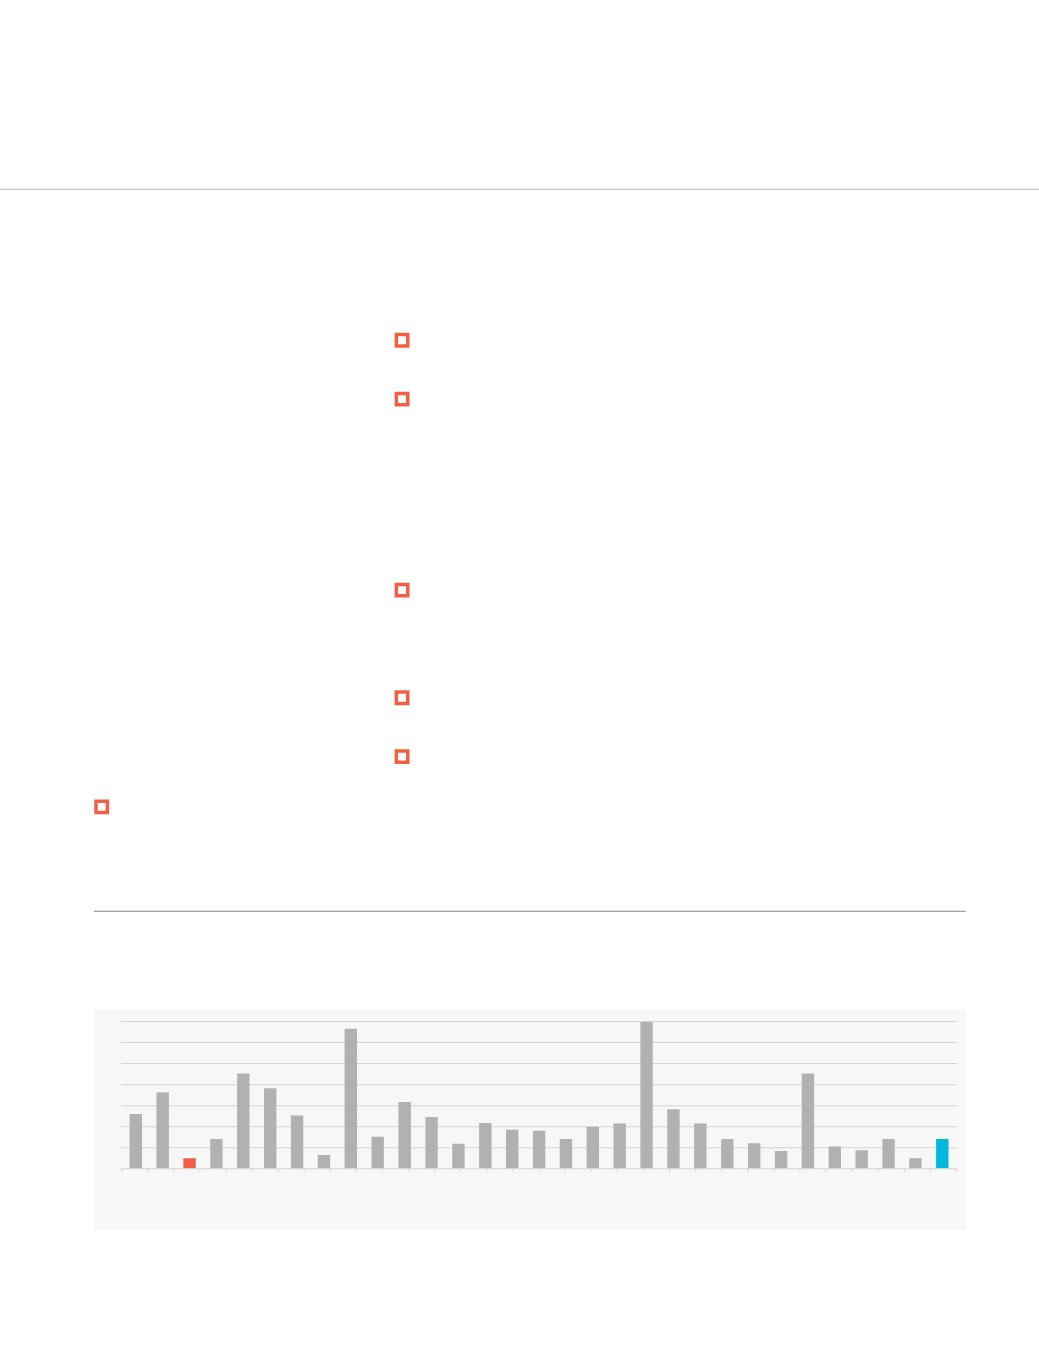
India has the lowest per capita consumption in the category dominated by emerging nations
Per capita consumption (sq. m) of tiles among the top 30 consumers globally
Note: for CY10. Source: Ceramics World Review, World Bank and Credit Suisse
In order of geographies with highest tiles consumption to lowest _>
7.0
6.0
5.0
1.0
2.0
3.0
4.0
0.0
China
Brazil
India
Indonesia
Iran
Vietnam
Egypt
USA
Saudi
Maxico
Spain
Italy
Russia
Turkey
Thailand
France
Germany
SKorea
Poland
UAE
Malaysia
Morocco
Argentina
Colombia
UK
Portugal
Ukraine
SAfrica
Algeria
Philipines
World
2.6
3.6
0.5
1.4
4.5
3.8
2.5
0.6
6.6
1.5
3.1
2.4
1.1
2.1
1.9 1.8
1.3
2.0
2.8
2.1
1.4 1.2
0.8
4.5
1.0 0.9
1.4
0.5
1.4
2.2
~13.3
29


