efficient operations management and
an entrenched marketing presence
enabled the Company to derive the
maximum returns from these inorganic
initiatives. The capital employed has
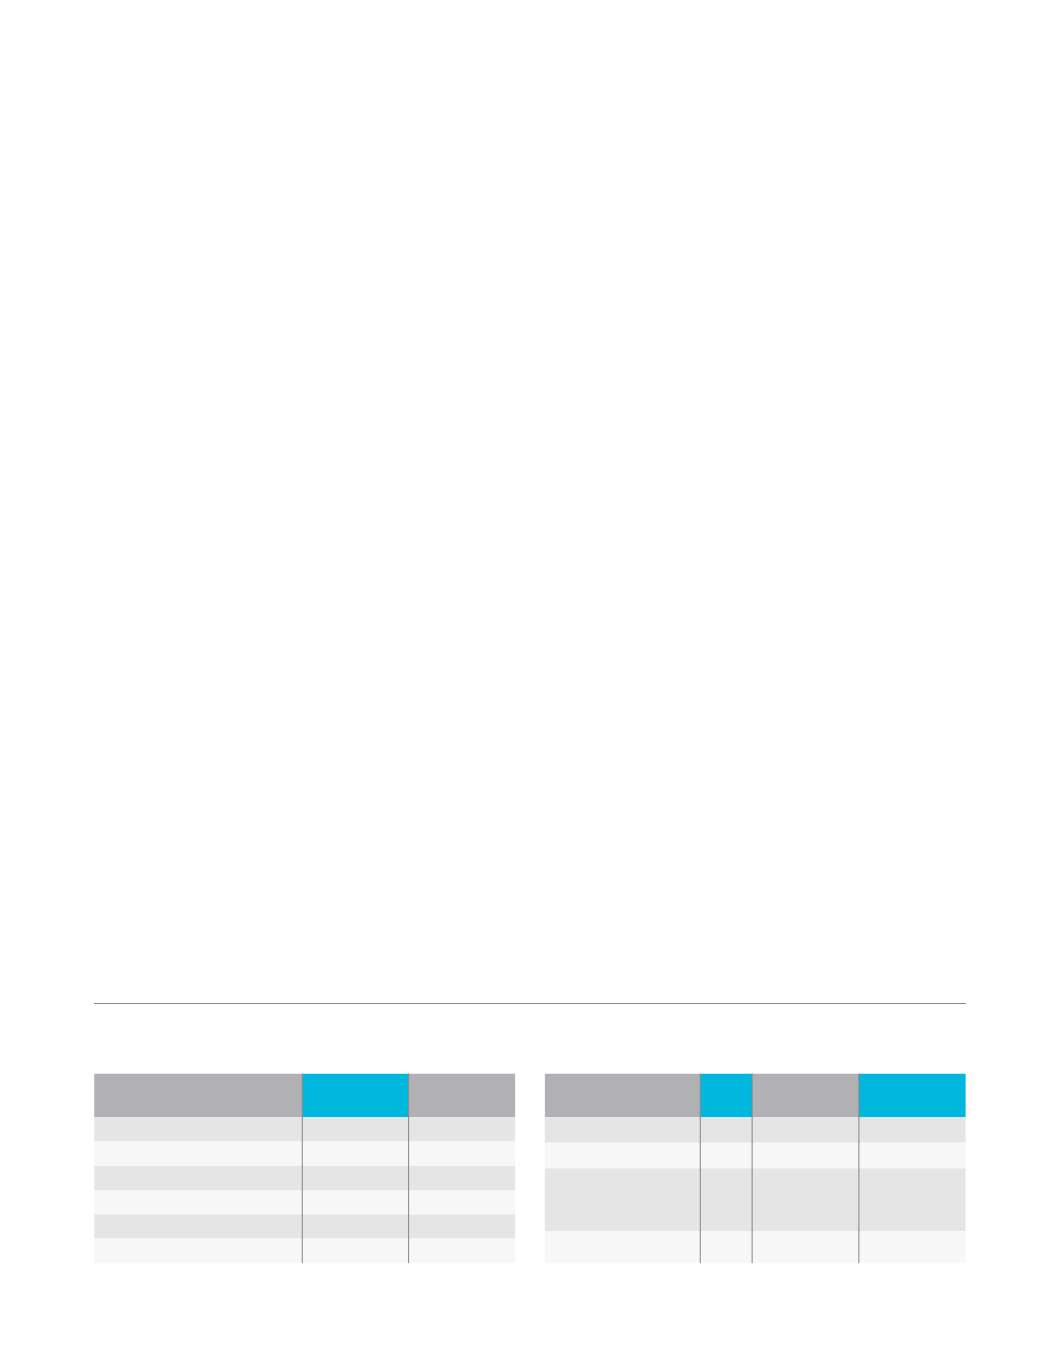
been calculated as per Table A below.
As a result, the Company’s ROCE grew
93 bps from 27.96% as on March 31,
2012 to 28.89% as on March 31, 2013.
Shareholders’ funds
Shareholders’ funds increased 28%
from
`
2,820.71 million as on March
31, 2012 to
`
3,608.78 million as on
March 31, 2013 owing to an increase
in ploughback of business profits.
As a result, the reserves and surplus
balance grew 29% from
`
2,673.54
million as on March 31, 2012 to
`
3,461.61 million as on March 31,
2013. The equity capital remained
unchanged at
`
147.17 million – the
promoters holding 53.51% of the
Company’s equity (March 31, 2013).
Shareholders’ fund as a proportion of
capital employed, stood at 46.61% as
on March 31, 2013 against 44.64%
as on March 31, 2012. The book value
per share climbed from
`
38.33 as on
March 31, 2012 to
`
49.04 as on March
31, 2013.
External debt
The Company’s debt portfolio
expanded from
`
2,781.92 million as on
March 31, 2012 to
`
3,201.66 million
as on March 31, 2013. This increase
was largely due to the new joint-
ventures of the Company with other
tile manufacturers. On a standalone
basis, the Company’s debt declined
by
`
253.41 million due to reduction
in long term debts. There is no foreign
currency loan outstanding as on March
31, 2013.
Despite the increase in absolute debt,
the debt-equity ratio declined to 0.82
as on March 31, 2013 from 0.96 as on
March 31, 2012.
As per the new regulatory guidelines,
Schedule VI (‘Balance Sheet’) grouping
has been altered. Total debt is reflected
in the Balance Sheet under the various
heads as per Table B below.
Fixed Assets
The continuous acquisitions spree
has been primarily responsible for
the addition to the gross block in
the last 12-18 months. In 2012-13,
the gross block increased by 17%
from
`
7,826.60 million as on March
31, 2012 to
`
9,194.50 million as on
March 31, 2013 due to routine capital
expenses and acquisitions of Vennar
which commenced operations in July
2012 and Cosa Ceramics in October
2012.
Depreciation:
The Company
consistently charged depreciation
under the ‘Straight Line Method’
as specified in the Companies Act,
1956. The provision for depreciation
increased 14% from
`
392.58 million
in 2011-12 to
`
446.18 million in
2012-13. This was due to the addition
in gross block during the year under
review. Accumulated depreciation, as
a proportion of the Gross Block, stood
at 32.57% as on March 31, 2013
representing the contemporariness
of the Gross block – an important
competitive edge in a cluttered
industry space.
Investments
The Company’s investment stood at the
level of last year i.e
`
0.81 million as on
March 31, 2013.
Net current assets
Net current assets (working capital)
increased from
`
1,084.91 million
As at March
31, 2013
As at March
31, 2012
Shareholder’s funds
3,608.78
2,820.71
External debt
3,201.66
2,781.92
Deferred tax liabilities
656.27
643.68
Minority interest
275.19
72.20
Capital employed
7,741.90
6,318.51
Average capital employed
7,030.21
6,022.52
Table A: Capital employed in business
(
`
million)
Table B: Reconciliation of external debt
(
`
in million)
Note
As at March
31, 2013
As at March
31, 2012
Long-term borrowings
4
892.69
916.75
Short-term borrowings
7
1,735.06
1,143.28
Current liabilities -
current maturities of
long-term debts
9
573.91
721.89
Total
3,201.66
2,781.92
37


