Global tile
industry
Italy and Spain are exceptions as
exporters, given their reputation for
quality and design. China dominates
the export trade as the number one
exporter. Over the last few years,
India’s global competitiveness has
strengthened on account of lower
incremental capex, growing scale and
increasing labour costs in China and
the softening of the Indian rupee.
Global production and consumption
reported double-digit growth in CY
2011. World tile production broke
the 10 billion sqm in CY 2011. Asia
retained its dominance in the global
tile sector, accounting for 68% of the
total production. Its output of 7,179
MSM in 2011 was 12.9% higher than
over 2010. World tile consumption
reached to 10,370 MSM (10.2% up
from 2010). Asia registered the largest
demand growth of 13.3% in 2011.
The global ceramic tile industry is localised; the top countries are prominent
consumers too.
Regions
2011
(MSM)
% age
of world
production
2010
(MSM)
% age
variance
(2011/2010)
China
4,800
46 4,200
14
Brazil
844
8 753
12
India
617
6 550
12
Iran
475
5 400
19
Italy
400
4 387
3
Spain
392
4 366
7
Vietnam
380
4 375
1
Indonesia
317
3 287
10
Turkey
260
2 245
6
Mexico
219
2 210
4
World Total
10,512
100 9,546
10
Source: Ceramic World Review
Global manufacturing locations
Regions
2011
(MSM)
% age
of world
production
2010
(MSM)
% age
variance
(2011/2010)
China
4000
39 3500
14
Brazil
775
7 700
11
India
625
6 557
12
Iran
395
4 335
18
Vietnam
360
3 330
9
Indonesia
312
3 277
13
Saudi Arabia
203
2 182
12
USA
189
2 186
2
Russia
181
2 158
15
Mexico
177
2 168
5
World Total
10,370
100 9,410
10
Source: Ceramic World Review
Global consuming centers
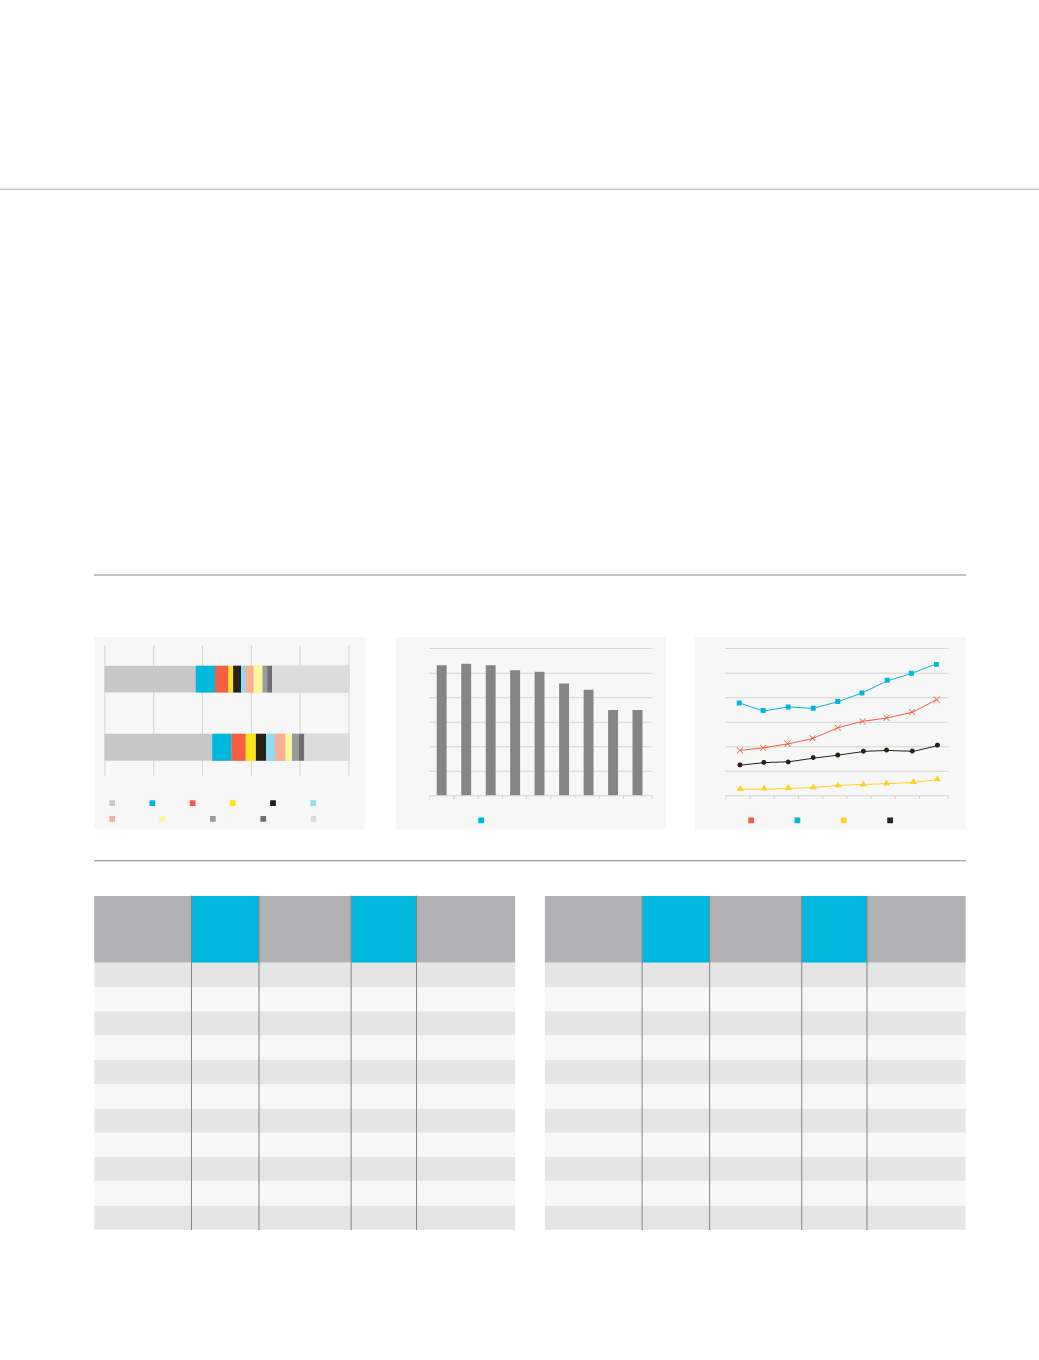
Global production and consumption by
country by 2010
Source: Ceramics World Review
37% 7% 6%
Consumption
Production
44%
8% 6%
0%
100%
80% 60%
20% 40%
China
Vietnam
Brazil
Indonesia
India
Turkey
Italy
Egypt
Iran
Others
Spain
Export as a % of consumption is declining
Source: Ceramics World Review, Credit Suisse
28%
25%
22%
19%
16%
13%
10%
2002 2003 2004 2005 2006 2007 2008 2009 2010
Exportas%ofconsumption
Per capita consumption
(in sq. mtr.)
Source: Ceramics World Review, Credit Suisse
4.0
3.0
2.5
3.5
2.0
1.5
1.0
0.5
0
2002 2003 2004 2005 2006 2007 2008 2009 2010
China
Brazil
India
Global
27


