Balance Sheet
Kajaria’s strength is resident
in its Balance Sheet. The
Company’s prudent policy
of reinvesting operational
surplus in asset building and
de-leveraging its financial
statement has created a
virtuous cycle of growing
liquidity and strengthening
reserves. This has helped
the Company in reporting
industry-beating results – a
low debt-equity ratio with a
healthy return on assets.
Capital employed in the
business increased by 23%
from
`
1125.95 crore as on
March 31, 2015 to
`
1386.35
crore as on March 31, 2016
owing to capacity addition
and an increase in working
capital. The return on capital
employed stood at 31.41%
in 2015-16 against 30.49% in
2014-15.
Shareholders’ funds increased
by 24% from
`
740.94 crore as
on March 31, 2015 to
`
922.32
crore as on March 31, 2016.
This growth was owing to an
increase in the reserves and
surplus balance consequent
to a reinvestment of profits
earned during the year. Equity
capital remained unchanged
at
`
15.89 crore.
The Company’s debt portfolio
increased from
`
243.43 crore
as on March 31, 2015 to
`
296.29 crore as on March 31,
2015. The Company’s debt-
equity ratio stood at 0.30x as
on March 31, 2016, similar to
the previous year.
The Company’s Gross
Block increased by 24%
from
`
1244.67 crore as on
March 31, 2015 to
`
1541.37
crore as on March 31, 2016.
This increase was due to
the addition of tangible
assets consequent to the
Company’s tile manufacturing
capacity addition and
commissioning of its faucets
facility. The balance under
capital work-in-progress
declined to
`
7.83 crore as
on March 31, 2016 against
`
77.76 crore as on March
31, 2015 consequent to the
commissioning of planned
projects.
The working capital cycle
increased from 28 days as
on 31st March 2015 to 46
days as on 31st March 2016
primarily due to increase in
inventories and receivables
due to challenging market
conditions, increased cash
and bank balance and
reduction in import creditors.
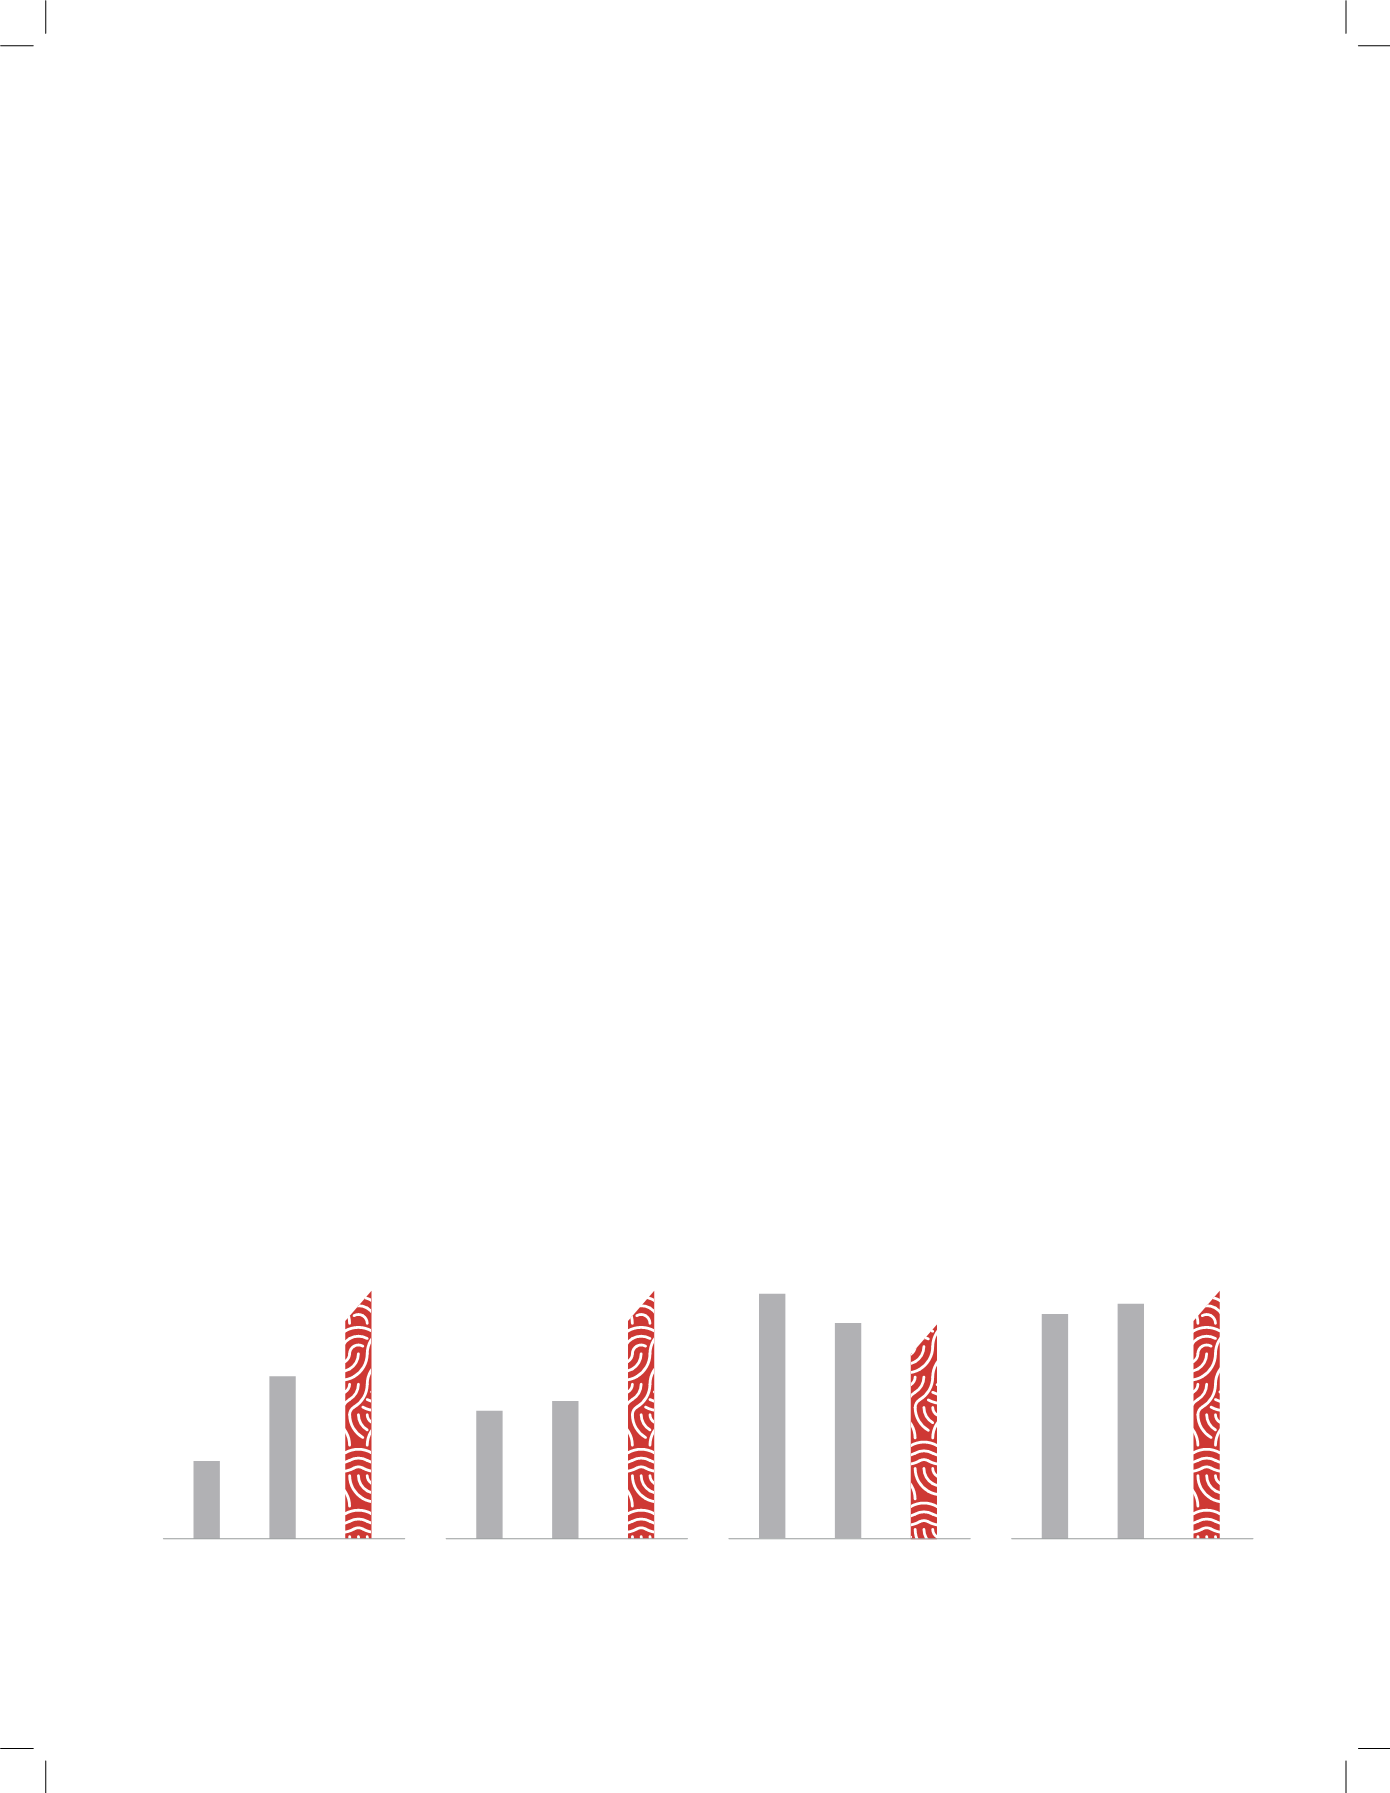
Debt-equity (x)
13-14
0.41
14-15
0.30
15-16
0.30
Addition to Gross Block
(
`
crore)
13-14
95.06
14-15
221.12
15-16
289.43
ROCE (%)
13-14
29.06
14-15
30.49
15-16
31.41
Working capital cycle
(days)*
13-14
25
14-15
28
15-16
46
*excluding project creditors
ANNUAL REPORT 2015-16
l
43


