average 6.5% in 2014-15,
could decline to 5.0-5.5% in
2015-16, clearing the path
for further monetary policy
easing.
Assuming a further
moderation in the average
annual price of crude
petroleum and other
commodities, the current
account deficit is estimated
at about 1.3% of GDP for
2014-15 and less than 1% of
GDP in 2015-16.
Outlook:
Given the macro
economic scenario and
assuming normal 2016
monsoons, it would not
be unreasonable to believe
that the Indian economy
is set to register growth
in excess of 7% for the
third year in succession.
Against an unsupportive
global economic landscape
and weak back-to-back
monsoons, a 7.6% GDP
growth in 2015-16 (as
estimated by the Central
Statistics Organisation)
appears possible.
The Economic Survey
2015-16 mentions that oil
prices (Indian crude basket)
might average US$35 per
barrel in the next fiscal year
compared with US$45 per
barrel in 2015-16.
The
global tile industry
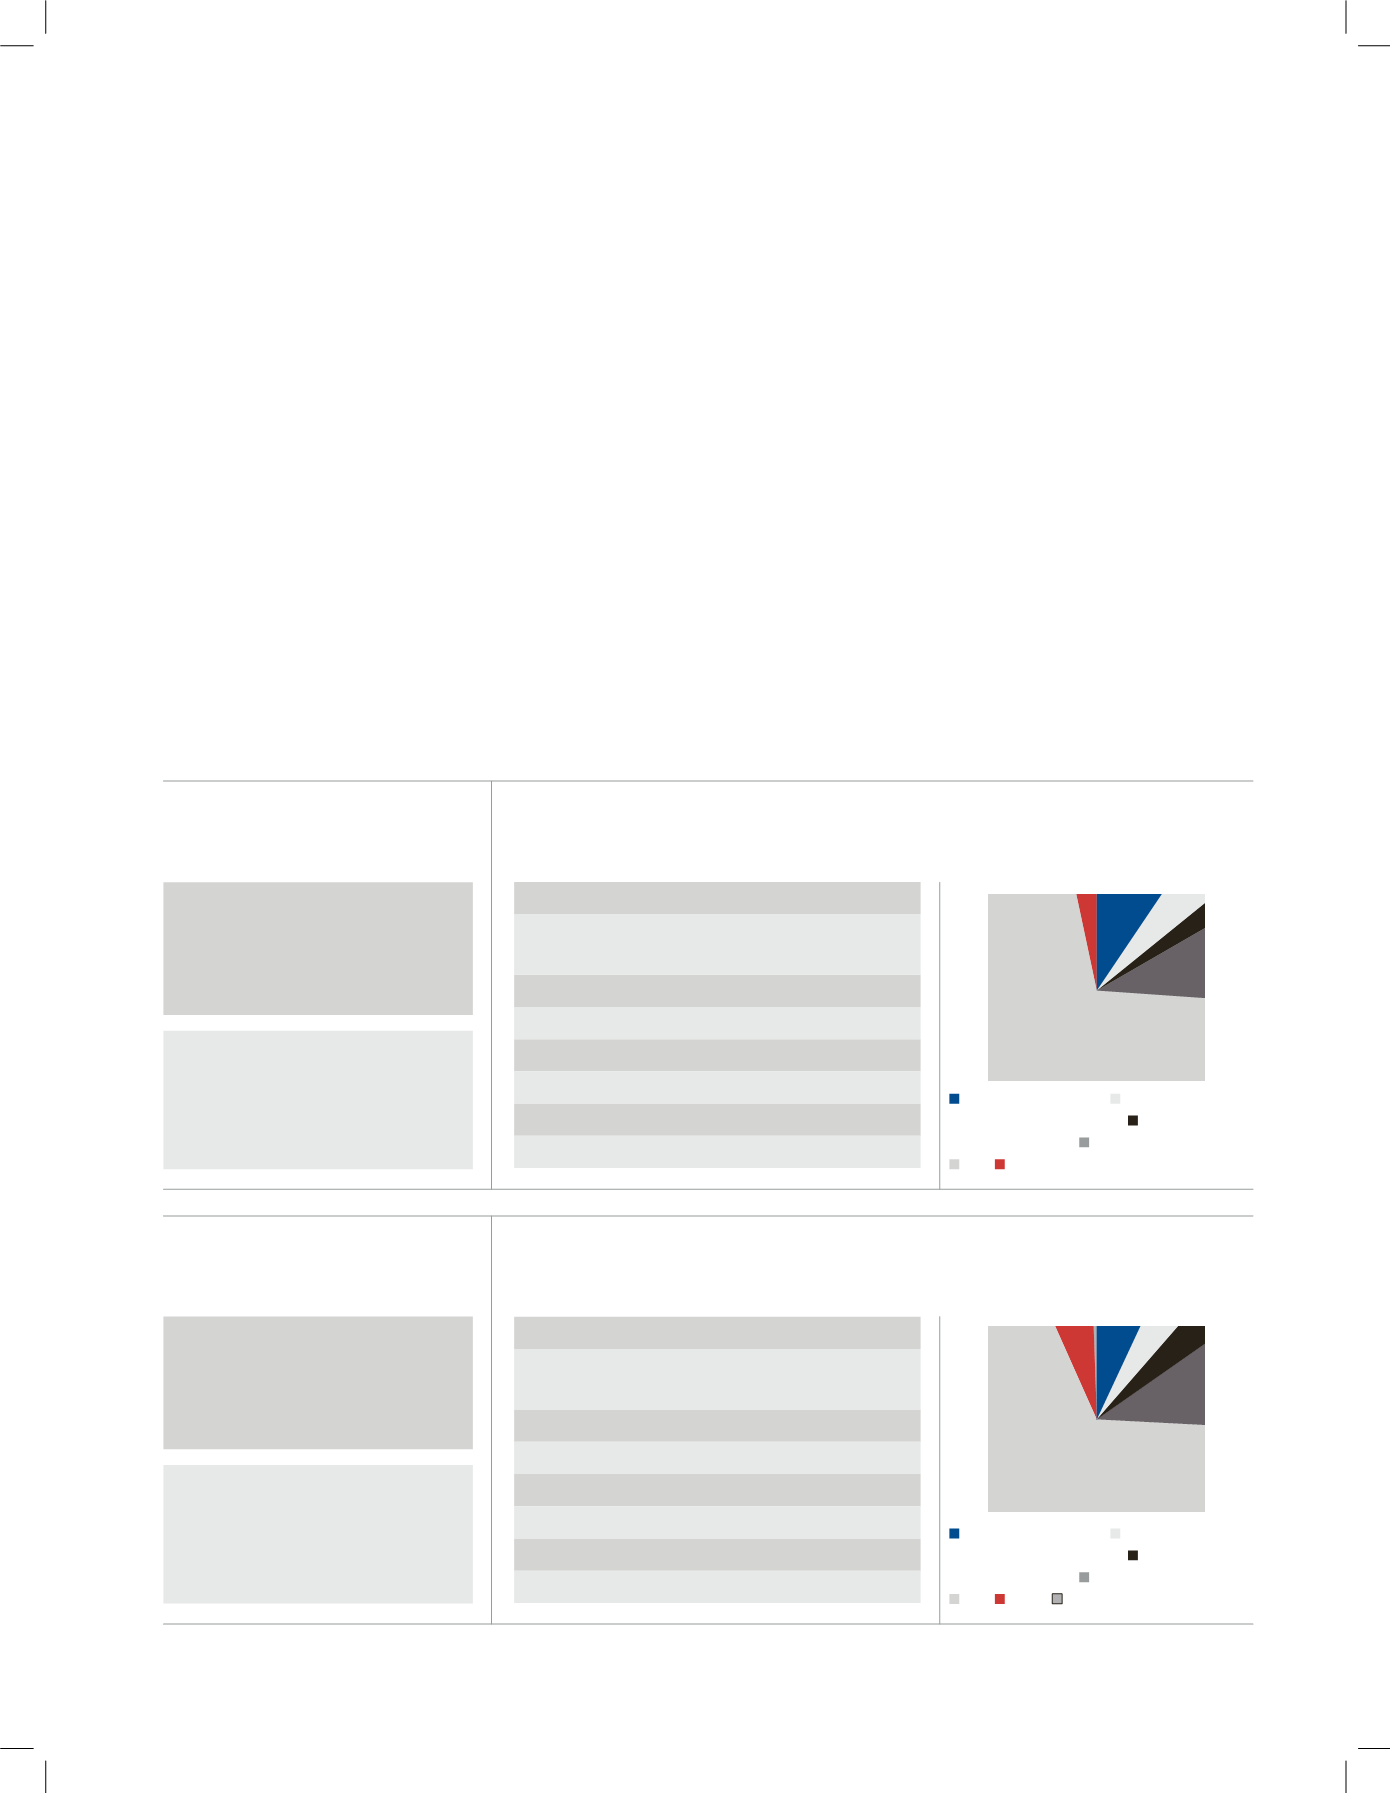
Production
Region-wise tile
production
in CY 2014
Volume share (%)
Volume (million square metres)
European Union (28)
1,192
Other European nations
(including Turkey)
570
North America (including Mexico)
308
Central-South America
1,191
Asia
8,747
Africa
396
Oceania
5
Total
12,409
9.6
4.6 2.5
9.6
70.5
3.2
European Union (28) Other European
nations (including Turkey) North America
(including Mexico) Central-South America
Asia Africa
The
global tile industry
Consumption
12,095
MSM
Tile consumption in 2014
4.2
%
Growth in tile
consumption over 2014
Region-wise tile
consumption
in CY 2014
Volume share (%)
Volume (million square metres)
European Union (28)
848
Other European nations
(including Turkey)
543
North America (including Mexico)
462
Central-South America
1,282
Asia
8,166
Africa
746
Oceania
48
Total
12,095
European Union (28) Other European
nations (including Turkey) North America
(including Mexico) Central-South America
Asia Africa Oceania
7.0
4.5
3.8
10.6
67.5
6.2
0.4
12,409
MSM
Tile production in 2014
3.6
%
Growth in tile
production over 2014
ANNUAL REPORT 2015-16
l
29


